Social Engagement Report
Use the Social Engagement Report to see the success of social messages scheduled across social platforms. The types of social profiles supported in this report are Facebook Pages and Groups, Twitter, Instagram Business, and LinkedIn Company Pages.
To view your Social Engagement Report, click Analytics from the sidebar menu and then choose Social Engagement Report. To begin, choose the filters that you want to apply to your report. You have options to filter by Social Profiles, Project Types, Tags, and/or Color Labels. You can combine filters to focus your report on the data of interest to you. CoSchedule offers Social Engagement Reports for the networks whose engagement we track: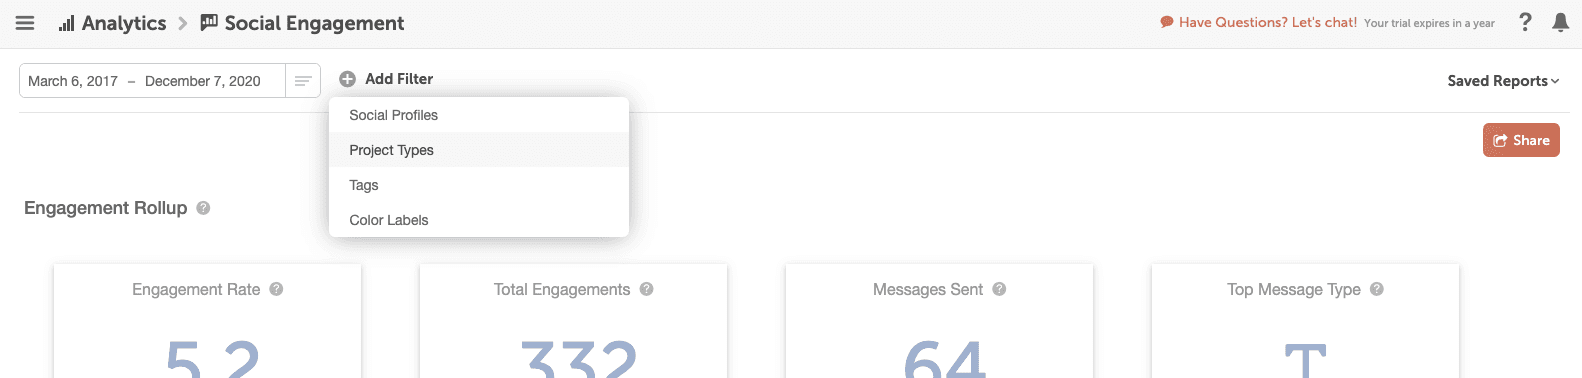 You can also select a date range by either choosing one of the predefined ranges (such as "Last 30 days" or "Last 3 months") or selecting specific dates by clicking on the dates shown in the fields. Note that data is limited to a rolling 13 months.
To save your filtered report, click Save Report in the upper right corner.
You can also select a date range by either choosing one of the predefined ranges (such as "Last 30 days" or "Last 3 months") or selecting specific dates by clicking on the dates shown in the fields. Note that data is limited to a rolling 13 months.
To save your filtered report, click Save Report in the upper right corner.
 * engagement rate is found by taking the total number of engagements divided by total number of messages sent.
These numbers will be compared to the "Last Period." If you select "Last 30 days," the "Last Period" will be from 60-31 days ago. If you select "Last 3 months," the "Last Period" will be data from 6-4 months ago.
* engagement rate is found by taking the total number of engagements divided by total number of messages sent.
These numbers will be compared to the "Last Period." If you select "Last 30 days," the "Last Period" will be from 60-31 days ago. If you select "Last 3 months," the "Last Period" will be data from 6-4 months ago.
Note: Social Engagement Reports are only available in Social Calendar, Content Calendar, and Marketing Suite.
To view your Social Engagement Report, click Analytics from the sidebar menu and then choose Social Engagement Report. To begin, choose the filters that you want to apply to your report. You have options to filter by Social Profiles, Project Types, Tags, and/or Color Labels. You can combine filters to focus your report on the data of interest to you. CoSchedule offers Social Engagement Reports for the networks whose engagement we track:
- Facebook Pages (Number of Likes, Comments & Shares per Social Profile)
- Twitter (Number of Likes, Replies & Retweets per Social Profile)
- Instagram Business (Number of Likes & Comments per Social Profile)
- LinkedIn Company Page (Number of Likes, Comments & Clicks per Social Profile)
You can also select a date range by either choosing one of the predefined ranges (such as "Last 30 days" or "Last 3 months") or selecting specific dates by clicking on the dates shown in the fields. Note that data is limited to a rolling 13 months.
To save your filtered report, click Save Report in the upper right corner.
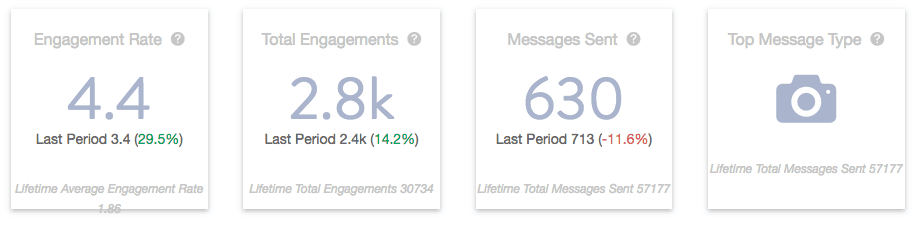
Engagement Rollup
In this section, view the average engagement, total engagement, messages sent, and top message type for your report.
* engagement rate is found by taking the total number of engagements divided by total number of messages sent.
These numbers will be compared to the "Last Period." If you select "Last 30 days," the "Last Period" will be from 60-31 days ago. If you select "Last 3 months," the "Last Period" will be data from 6-4 months ago.
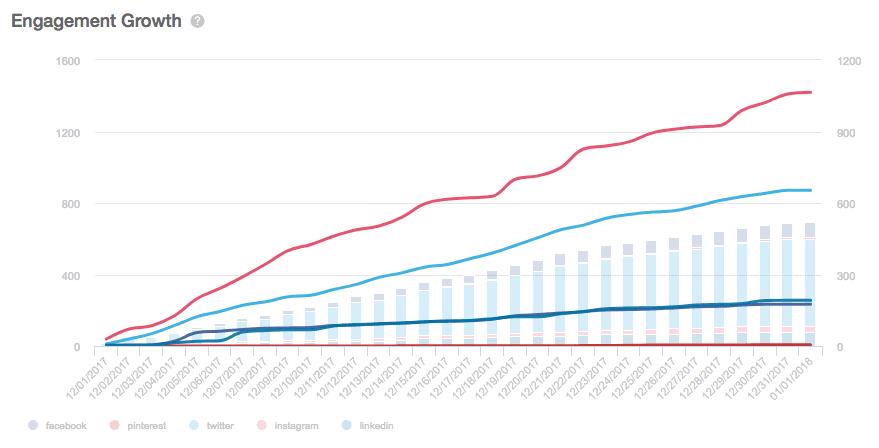
Engagement Growth
Review the number of messages you send and how they correlate with the number of engagements during the selected date range.
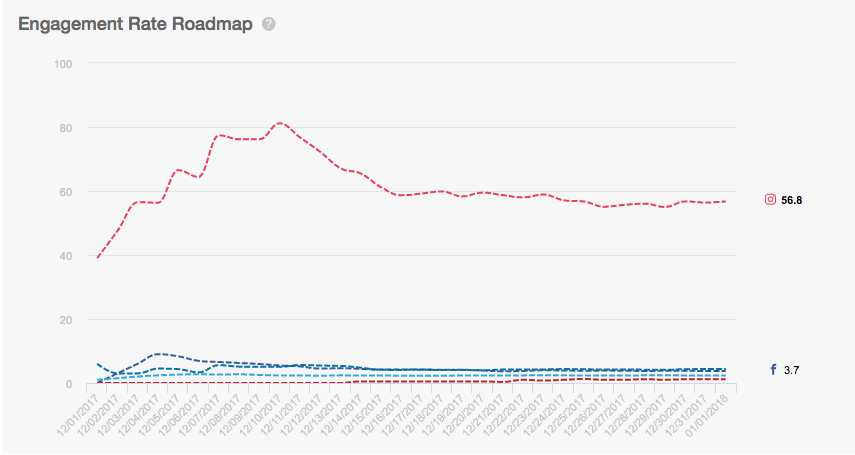
Engagement Rate Roadmap
The Engagement Rate Roadmap will identify peaks and valleys across engagement rate trend lines for each social network.
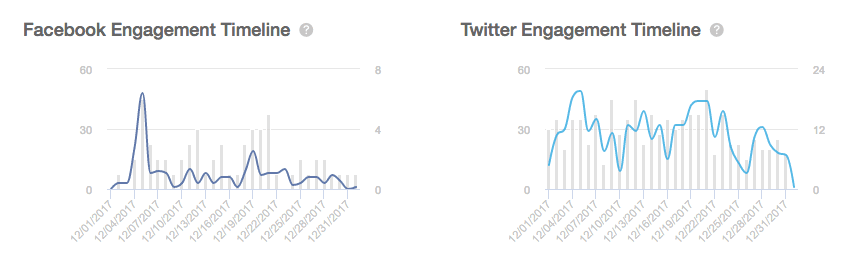
Engagement Timeline
The Engagement Timelines will allow you to review the amount of engagement on supported networks related to the number of messages sent during the selected date range.
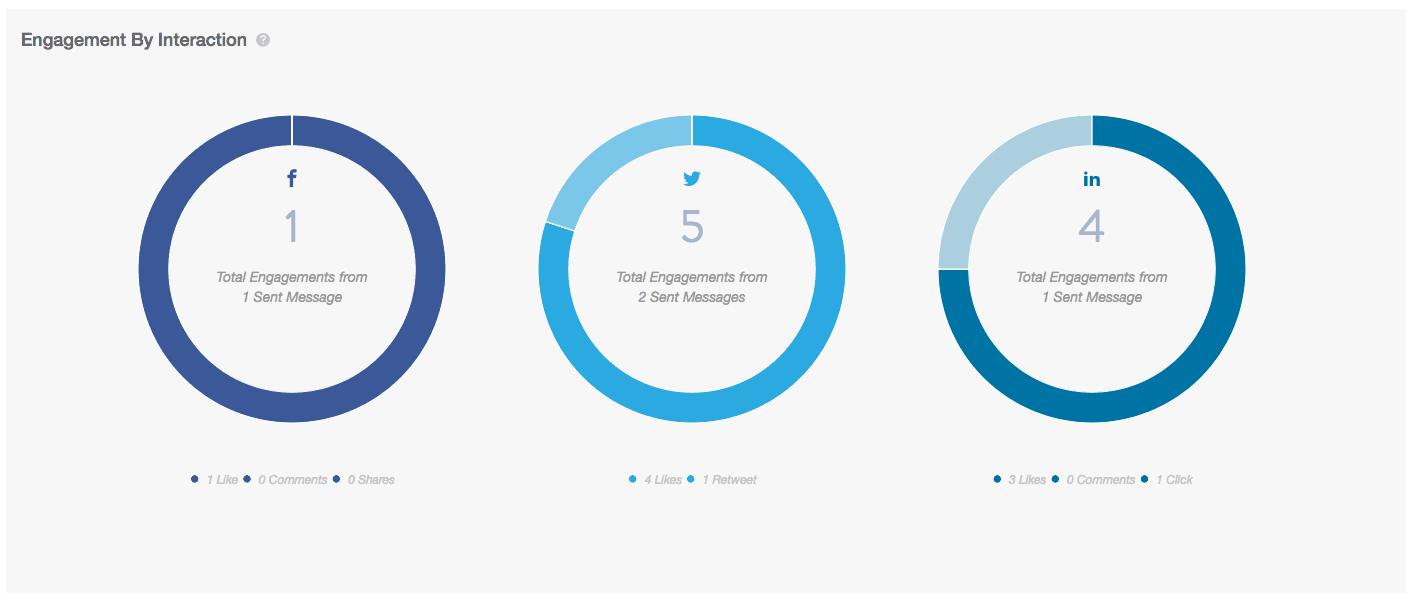
Engagement by Interaction
Get a breakdown of social engagements for each social network plus insight into your top-performing social channel.
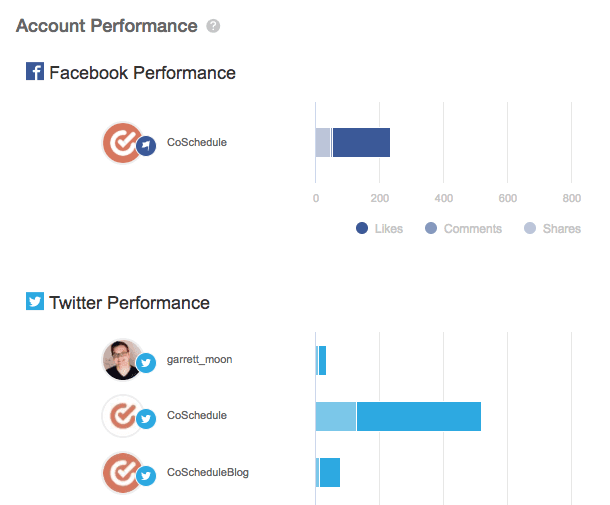
Profile Performance
Get an engagement breakdown for every social profile used in your report.
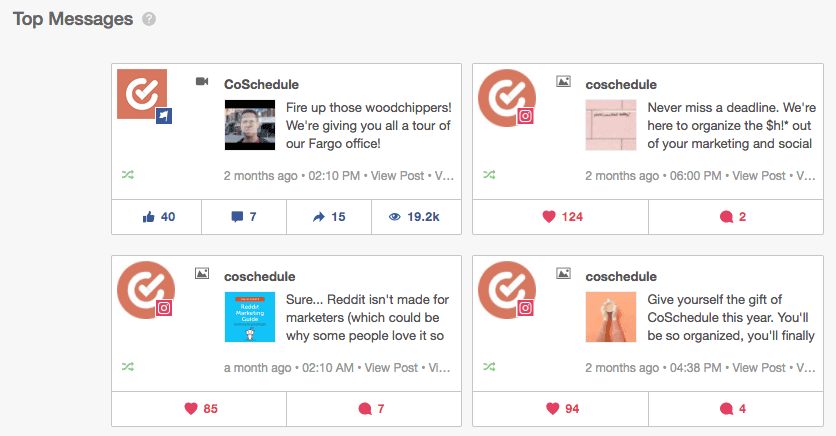
Top Messages
View the social messages with the most engagement over the duration of your report.
Note: Export and share any report with your team or client.
Frequently Asked Questions
How do you calculate engagement rate?
In our reporting, the social engagement rate is calculated by the total number of engagements (likes, comments, shares) divided by the total number of messages sent.How do you define engagement?
CoSchedule defines "engagement" for social networks as follows:
-
Facebook Pages & Groups: number of likes, comments, and shares for each Facebook social profile
-
Twitter: number of likes, replies, and retweets for each Twitter social profile
-
LinkedIn Company Page: number of likes, comments, and clicks for each LinkedIn social profile
-
Instagram Business: number of likes and comments for each Instagram social profile